VCF 9.1 VMSP Visualization
With the release of VCF 9.0GA we noticed the new VMSP (Bootstrapped K8S) concept of running VCF-components. At that moment there were only two products utilizing this method: VCFA and vIDB, both running their own instance (Controllers/Workers) of VMSP. Now, with the release of VCF 9.1 it’s clear that this VMSP platform plays an important role of running many more VCF components. Some of the new VMSP mandatory components are: Fleet Lifecycle (old vRSLCM appliance is obsolete), SDDC Lifecycle, Software Depot and some Salt/Telemetry components. Optionally, we can additionally deploy a new VCF-Logs instance based on VMSP.
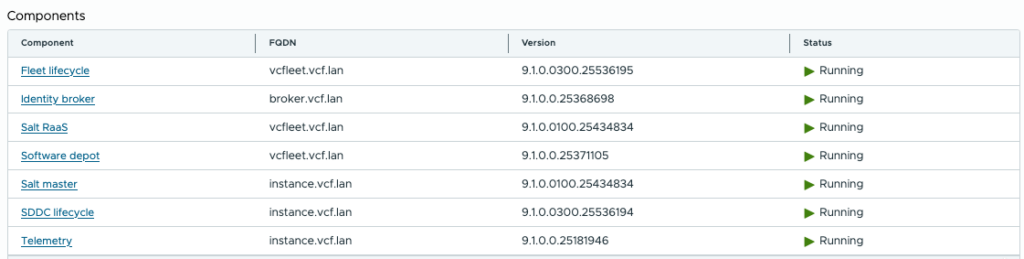
For future releases of VCF it’s expected that VMSP will eventually run all major components of VCF. Therefore, for vSphere Admins, it’s important to understand what is happening under the hood. Valentin’s blog already explains in great detail how the platform is designed and how to troubleshoot it. This is normally done by using kubectl cmdline commands.
After having experienced K8S visibility tools (like Octant) in the TKG/Tanzu era, I wondered if we could use the same for visualizing the VMSP environment. After some short investigation I got this working using Radar which I will explain in the next paragraphs.
As explained VMSP is a bootstrapped K8S installation on vSphere consisting of minimally one Control Plane node and three Worker nodes, visible in vCenter and OPS (VCF Management Runtime):

First, we need to do is capturing the KUBECONFIG to be able to connect to the VMSP Cluster-API. We do this by starting a SSH-session to the Control Plane node and copying the config-file to our local workstation. Meanwhile, I’ll demonstrate how it would look like using kubectl to list namespaces and fleet-lcm pods.
# ssh vmware-system-user@192.168.10.128
Welcome to Photon 5.0 (\m) - Kernel \r (\l)
(vmware-system-user@192.168.10.128) Password:
Last login: Wed Jul  8 12:03:28 2026 from 192.168.1.29
vmware-system-user@vmsp-8qb7x [ ~ ]$ sudo -i
[sudo] password for vmware-system-user:

root@vmsp-8qb7x [ ~ ]# export KUBECONFIG=/etc/kubernetes/admin.conf
root@vmsp-8qb7x [ ~ ]# kubectl get ns
NAME              STATUS   AGE
default           Active   33d
kube-node-lease   Active   33d
kube-public       Active   33d
kube-system       Active   33d
salt              Active   33d
salt-raas         Active   33d
telemetry         Active   33d
vcf-fleet-depot   Active   33d
vcf-fleet-lcm     Active   33d
vcf-sddc-lcm      Active   33d
vidb-external     Active   33d
vmsp-platform     Active   33d
vmsp-policies     Active   33d

root@vmsp-8qb7x [ ~ ]# kubectl -n vcf-fleet-lcm get pods
NAME                                                      READY   STATUS    RESTARTS      AGE
vcf-fleet-build-service-fleetbuild-7d74468c9c-f88vv       1/1     Running   0             25m
vcf-fleet-lcm-db-0                                        3/3     Running   3 (24h ago)   33d
vcf-fleet-lcm-db-1                                        3/3     Running   3 (24h ago)   33d
vcf-fleet-lcm-db-2                                        3/3     Running   3 (24h ago)   33d
vcf-fleet-upgrade-service-fleetupgrade-67f494cd75-4fhdk   1/1     Running   0             25m

root@vmsp-8qb7x [ ~ ]# scp /etc/kubernetes/admin.conf user@192.168.1.29:/Users/user/vmsp-cluster.conf
Now we have this file available on the local device, we need to set the environment-variable:
export KUBECONFIG=/Users/user/vmsp-cluster.confEverything is set to start installing/running Radar! Please use the instructions from the link to make it work for your device. In my case it was an easy curl-cmdline and for Windows users please use the scoop-method.
So, this is where it really starts to get interesting! After launching Radar we should see your browser opening with an overview of all K8S objects found. Immediately we notice a very nice overview of all running pods, deployments, nodes and resource utilization.

Another interesting view is the POD-Topology, which corresponds to what we know from VCF-OPS:
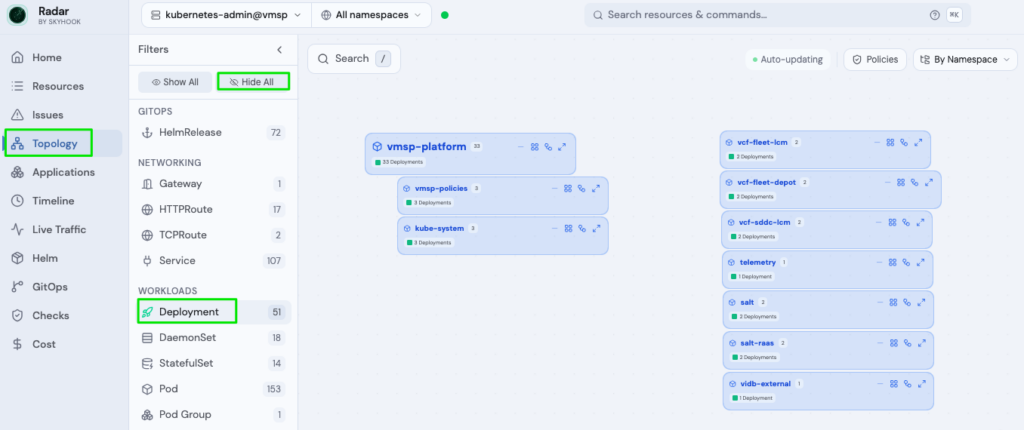
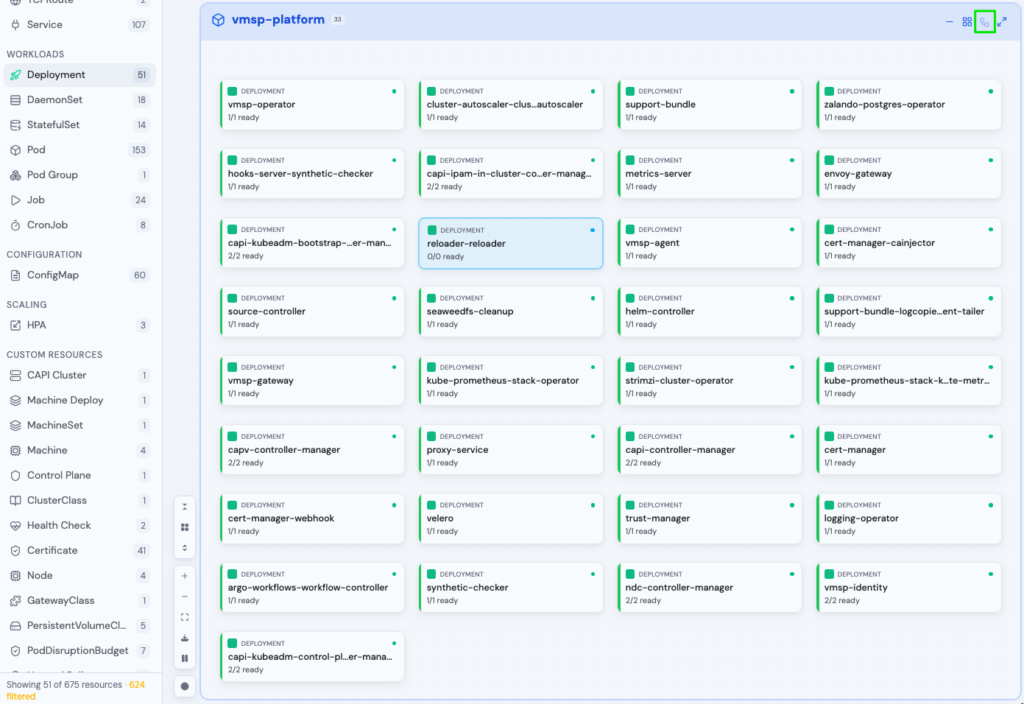
Zooming in on the VMSP-platform itself is also possible. From there we could possibly identify why certain functionality does not work as expected.
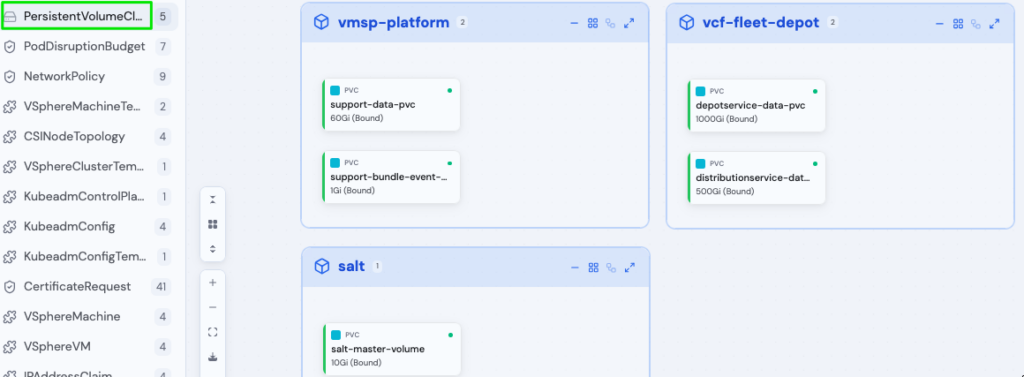
Or, Persistent Volume Claim status (also visible in vCenter: Cluster>Monitor>CloudNativeStorage>ContainerVolumes):
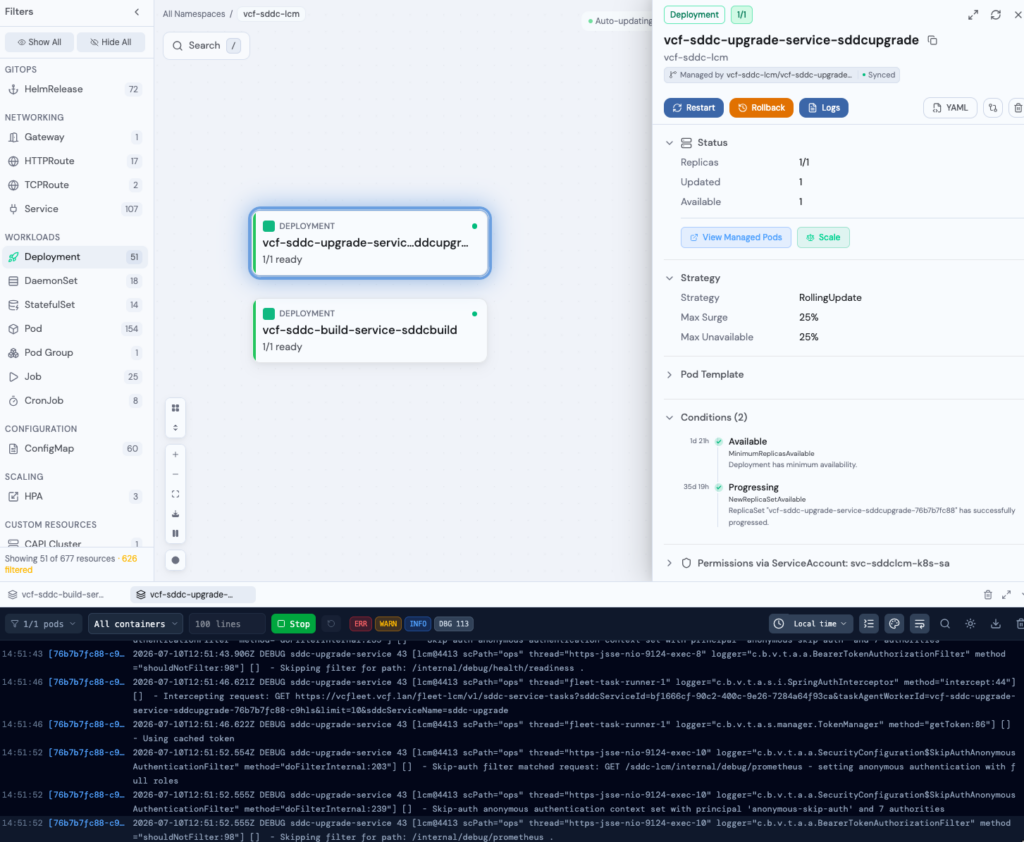
Visibility possibilities are almost endless by zooming into the details. It’s also possible to get details of a deployment and the logs produced:
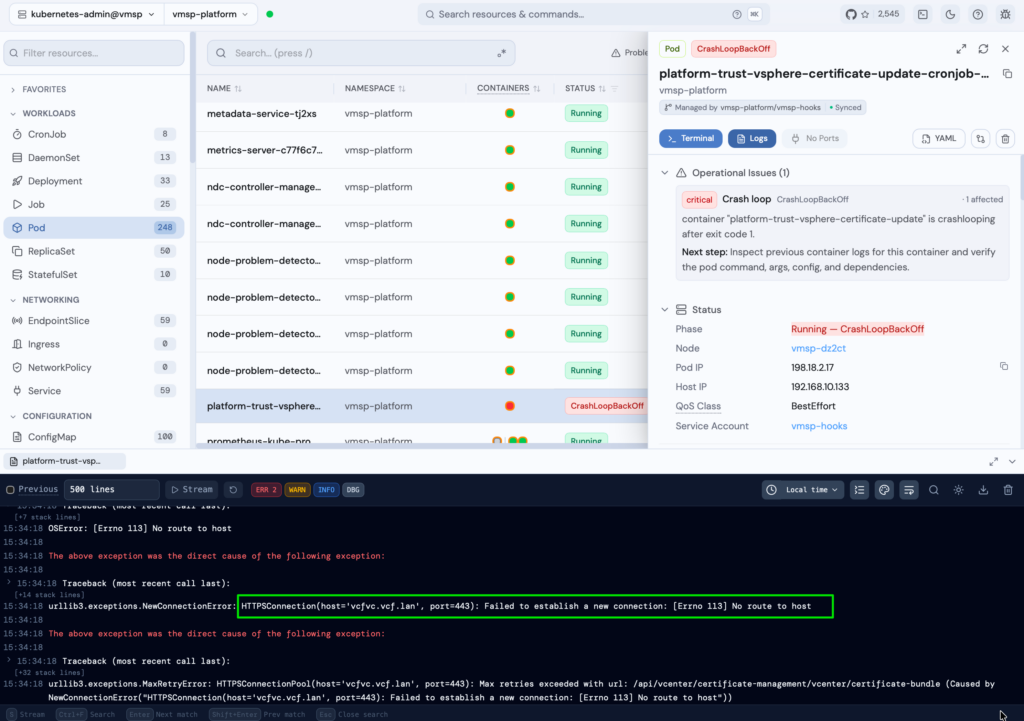
Even in situations where things are temporary unavailable it’s interesting to view how the VMSP-platform behaves. In this case an upgrade of a vCenter where VMSP-pod is complaining about the connection to vCenter.
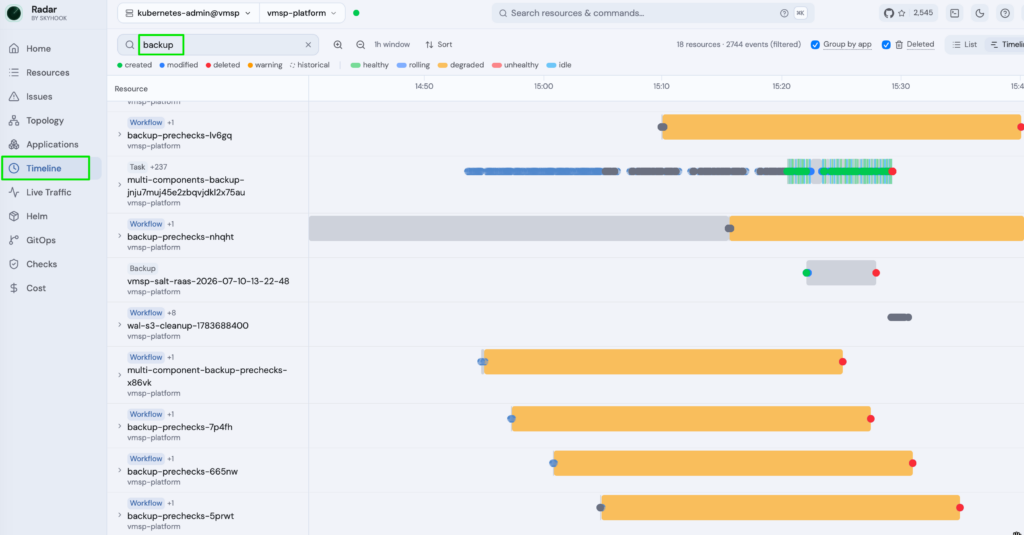
Finally, an useful feature of Radar is to monitor the timeline of events within the VMSP-platform. In this case, monitoring the VMSP Backup workflow (triggered in OPS>VCF Management>Backup&Restore):
This is were I will end this update and leave it up to you to make use of this possibility to understand what is happening under-the-hood of VMSP. Of course, do NOT try to mitigate issues with tools like Radar! Work with Broadcom support to get VMSP issues fixed!!